Editor’s Note: This article is part of Storybase, a series of occasional articles exploring new forms of interactive storytelling.
When Girl Scout season hit, Los Angeles Times writer Ron-Gong Lin was on a quest for a full set of America’s favorite cookies. To do so, he needed to buy from two different Girl Scout moms in his office, who happened to live in different counties. That led Lin to discover that all Girls Scout cookies are not created equal – not by a long shot.
Lin was surprised to learn that the Girl Scouts have two different bakeries that make different types of cookies. Each of the 120-plus Girl Scout Regional Councils across the country is assigned to one bakery.
As it turns out, the council in Los Angeles uses a different bakery than the council in nearby Orange County, so cookies sold by Girl Scouts in each area are different.
Lin soon discovered that the Thin Mints he grew up with at home in the San Francisco Bay area are made by ABC Bakers in Richmond, Va. They’re crunchier than the ones sold in L.A., which are made by Little Brownie Bakers in Louisville, Ky.
What’s more, Thin Mints are the only Girl Scout cookie with the same name regardless of where they come from. Dallas gets Samoas, caramel layered, dark chocolate-coated rings of goodness. Bordering city Fort Worth gets Caramel deLites, a similar cookie with milk chocolate and less gooey caramel in the middle.
After much office chatter, Lin teamed with co-writer Rosanna Xia and designer Jon Schleuss to do a deep dive into Girl Scout cookies. The trio enlisted staffer Javier Zarracina to make a video, and the team spent three months crafting a story and infographic to help readers cope with the news that their Girl Scout cookie of choice could have a fraternal twin somewhere else in the country.
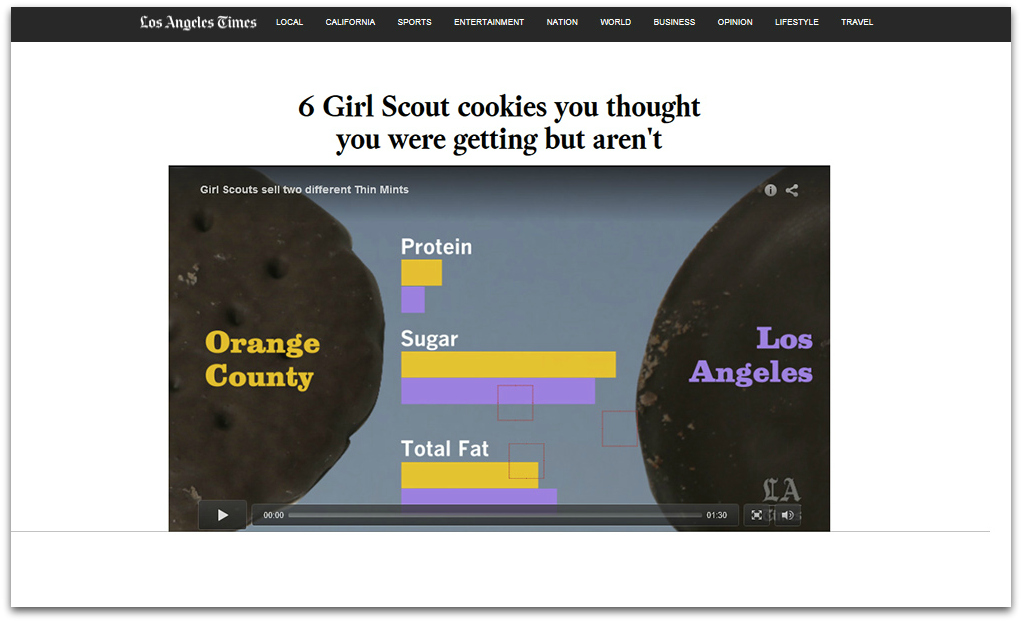
Their story titled “6 Girl Scout cookies you thought you were getting but aren’t” ran on March 4. It opens with a video of a taste test. Two cookies are set on a plate, one from each of the official bakers. They look and taste different, but each taste-tester recognizes one more as more familiar.
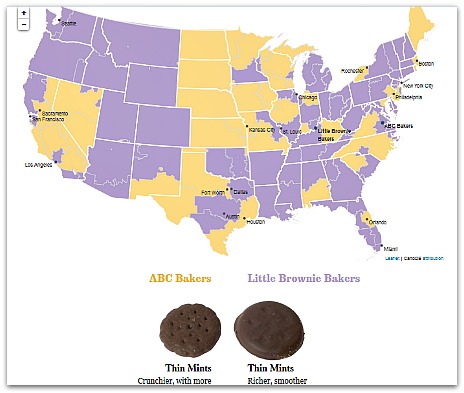
Below the video, the team plotted these differences in an interactive map of the United States, so anyone can scroll over their hometown or search a zip code to see where their cookies are coming from and what this means for their taste buds.
The map is color coded; purple areas get cookies from Little Brownie Bakers, while yellow areas get cookies from ABC Bakers. The story offers both visual and written explanations of the differences. Bar graphs compare production costs, calories, total fat, sugar and protein.
After the story ran, people across the country were talking cookie inequality. Boston Magazine wrote “Western Massachusetts is getting better Girl Scout cookies than Boston. Grave injustice! Most bitter inequity!”
The Atlantic commented, “‘More cookie than caramel’; ‘milkier chocolate’—the ABC version’s flavor profile is just a jumble of euphemisms for “cheap.” Little Brownie Bakers clearly wins.”
The project attracted 800,000 page views in addition to the feedback from baffled readers and various articles in response to the Girl Scout cookie truth. The average viewer spent five minutes playing with the map, according to Lin.
To get a taste of what it took to produce this project, American Journalism Review interviewed its producers, Lin, Schleuss and Xia. Below is a transcript of that interview, condensed and edited for clarity.
American Journalism Review: Where did the story and interactive element ideas come from?
Xia: Everyone in the newsroom is from different parts of the country. And everyone started talking about their Girl Scout cookies and whether they knew what a Samoa was…We realized quickly how polarizing and how opinionated people get about their Girl Scout cookies. We made a few calls to the Girl Scouts and learned how they organize their “Girl Scout Councils.” There were 120 or so of them organized by zip code. [They] were slightly arbitrary if you look at the boundaries. And we thought it would be really cool to map the U.S. based on how the Girl Scouts split their regions.
AJR: What came first – the story idea or the interactive?
Xia: I think from the get-go the approach was to do this as an infographic. Most of our infographics we put online as well as print, and to be able to do an interactive went hand-in-hand with the online component and the data visualization. We just took it from there.
Lin: Once we had the idea in hand, I bought cookies from both counties, a full set. We took photos of them. We both ate each of the cookies and Rosanna came up with the descriptions of the differences between the two cookies.
AJR: Do you think the infographic made the story better?
Lin: Oh yeah, definitely. This would never go if there was no graphic element to it. It just wouldn’t make sense as a normal story. I personally think the map was a brilliant idea that was really well executed by Rosanna and Jon. It provided a smarter story that gave you a really good, quick look into the universe of how Girl Scout cookies work.
Schleuss: The essential thing is having a product that can be unique to each individual. When you put in your own address, you see where you are and you see your cookies and you see their cookies. I also really enjoyed having a drawer full of Girl Scout cookies.
AJR: Who did what?
Xia: Jon is our very great NPR voice-over for the video in addition to all of the data visualization – the graphics, the layout, how you portray the calorie differences and also all of the programming involved with the interactive. Ron and I are reporters. We were the ones who were talking to the Girl Scouts, trying to get as much data as possible and doing a lot of the taste reporting, I guess you could call it. And anything else that is content behind the graphic itself. I called the Girl Scouts hoping they had a master list in how they broke up the councils. They didn’t and the [public information officer] told me they did it by zip code. They have a council finder on their website, which is basically plugging in the zip code and finding out which local council represented your Girl Scouts. Jon was great. We figured out a correlating council for each zip code and the correlating baker for each council.
Schleuss: And there are 30,000 zip codes in the country. It was really fun trying to figure out. It was basically trying to crunch all the data. We were basically collaborating. Ron, Rosanna and I have a Google Drive spreadsheet, and the spreadsheet had tons and tons of tabs…just full of every piece of data that you could associate with a Thin Mint. It was kind of ridiculous in a great way. So we narrowed down the important factors to show. So Rosanna and Ron spent a lot of time trying to track those down.
AJR: That sounds like a time-consuming project. Did you do this by hand?
Lin: Jon made this little computer program that made this possible.
Schleuss: It’s pretty simple, actually. You can get a computer to do something for you to make it happen; otherwise you’ll spend a lot of time doing something over and over again. And then you’ll go insane slowly. It took 15-16 hours to just get [which zip code belonged in which council]. But once we got that, we were able to sync up each zip code with each Girl Scout region and put that in a map. And then visual and color-code which baker belonged to which council.
AJR: Where did the color, font and image selections come from? Why did you choose what you did?
Schleuss: We have a few colors that we like. I usually start there. Purple and yellow, they make me think of Easter, and they make me think of candy.
Xia: And they print well on newspaper, too.
Schleuss: They were nice. They were easy to see, and they’re also color-blind friendly. We always try to make sure that we’re testing for that. The fonts are pretty much from our style guide.
AJR: What has the feedback been like?
Xia: It was one of our highest clicked web pages that month. It’s one of those things where it’s a fun topic, but done in a smart way and a surprising way. It started a conversation, which is a good goal for an infographic.
AJR: Would you do something like this again?
Schleuss: Absolutely. We’re doing this kind of thing all the time. Every day, all three of us probably have two or three new ideas.
Xia: This specific story was a humble reminder to me that you literally could find a story idea anywhere as long as you’re looking. Ron came up with this idea just buying Girl Scout cookies from the Girl Scout moms in the newsroom…It just kind of builds from there. We were able to expand the scope once we were talking to Jon about it. Javier, who sits next to Jon and heard us talking about it, got involved. A lot of final projects come together by just talking about it as a team. It was really cool to see how this project came about from a very basic, every day activity.
