

This article summarizes a research paper presented at the 2014 Computation + Journalism Symposium. Takis Metaxas is a computer science professor at Wellesley College. Eni Mustafaraj is an assistant professor in the department of computer science at Wellesley College. Samantha Finn is a research associate and manager of the Social Informatics Lab at Wellesley College. See the full collection of research summaries.
By Samantha Finn, Takis Metaxas and Eni Mustafaraj
Journalists on Twitter frequently come across tweets that contain interesting, surprising, alarming or otherwise newsworthy information.
Sometimes, deciding to retweet it is easy. The tweet comes from a trusted reporter. Or the tweet presents new information that fits with an ongoing story. But in some cases, it is difficult to know what to do. Retweeting false information can mislead the public. It’s not surprising that, when retweeting, reporters care that the message is trustworthy more than the average user.
TRAILS can help journalists decide when to retweet something.
Consider the following scenario. Around noon on March 27, a tweet was sent indicating that an airplane was spotted in the sea near the Canary Islands (Spain), just a few weeks after the disappearance of the Malaysian Airlines 370 flight on March 8.
Before retweeting, a journalist should ask:
- Who posted the story first?
- When and how did the story break?
- Is the story still spreading?
- Who has been retweeting — and distributing — the story?
- Are there any denials of the story competing for attention?
There are many ways to do this research. You can search different social networks and blogs or go to search engines, hoping someone else had done the research first. You can crowdsource the task to your social network and wait for leads. Or you can use TRAILS, our web-based, highly interactive and visually informative investigating system. (TRAILS is currently in an experimental form. You can investigate your own story by emailing twittertrails@gmail.com with a suggested starting tweet and/or a set of keywords that would retrieve relevant tweets on Twitter.)
TRAILS helps answer the above-listed questions within minutes. It automatically searches, sifts, filters and aggregates relevant Twitter messages. It surfaces Twitter users, links, images, and other items related to the story and displays the results in a series of interactive visualizations and lists.
TRAILS allows you to draw your own conclusions. Everything is stored by TRAILS and you can go back at any time to revisit your investigation or share it with your colleagues.
Here is how TRAILS would have helped you decide whether to retweet the information about the plane near the Canary Islands.
TRAILS Case Study: Plane in the Sea
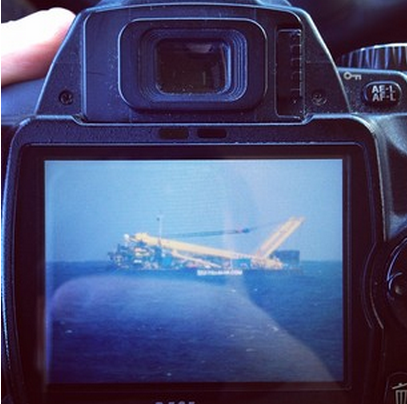
On March 27 at 10:53 a.m., @rafaleonortega, a sports reporter in the Canary Islands, tweeted “Imagen del avión en el mar en estos momentos en Telde, Gran Canaria,” or, in English, “Picture of airplane on the sea right now in Telde, Canary Islands.” The picture is blurry, but an airplane-like object seems to be on the water surface. Thus, one rightly can ask: did a plane land on the water off the coast of the Canary Islands?

Is this tweet about a possible plane sighting over the Canary Islands true? (Screenshot)
We launched the TRAILS investigation starting with this tweet on March 27 at 12:04 p.m. The search terms we used were airplane, telde, gran canaria and imagen. Later we added avión to provide better filtering of the results.
Propagation Visualization
The first visualization generated by TRAILS is the propagation graph, containing the earliest tweets that can be found containing the requested keywords. Each of the points on the graph represents a tweet (hovering on the point displays the tweet text in a sidebar box), and contains various information from which we can discover some facts about how the “Plane in the Sea” story developed.
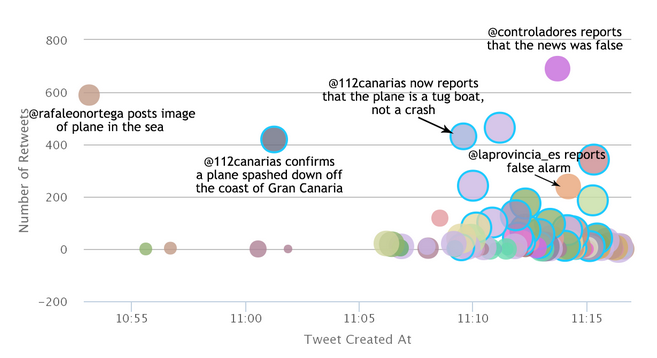
A visualization of tweets about the suspected plane crash near the Canary Islands. (Screenshot)
The graph shows that the tweets, spread over only 20 minutes, are varied in content (indicated by the different colors). Also that the number of retweets (on the y axis), and the users who have written them also vary in the number of followers they have (larger circles mean more followers). There is also a number of verified users (with blue borders), mostly news organizations.
The tweet that broke the news appears as the leftmost in the graph. It happens to be the investigative tweet, indicating that this is a main source of the story. It was spread fast, as indicate by the large number of retweets in a short period of time, probably due to its sensational nature and the accompanying image.
The next few tweets in the timeline also talk about a plane crashing in the sea, including a tweet at 11:01 a.m. from @112canarias, a verified account tweeting about emergencies in the Canary Islands (112 is similar to 911 in the U.S.). This tweet confirms that a plane splashed down off the coast, though they do not know the number of passengers. Less than 10 minutes later, at 11:09 a.m., @112canarias tweets again, now reporting that what was mistaken for a plane is actually a tugboat; however, this account is not well connected to the retweeting network and was missed by @rafaleonortega. The lack of good connectivity in the “Retweet Network” (see graphic below) limits the propagation of the correction. While other verified news accounts continue to report that a plane has crashed in the sea, the propagation of crash is diminished, as can be seen in the “Time Series of Relevant Tweets” visualization.
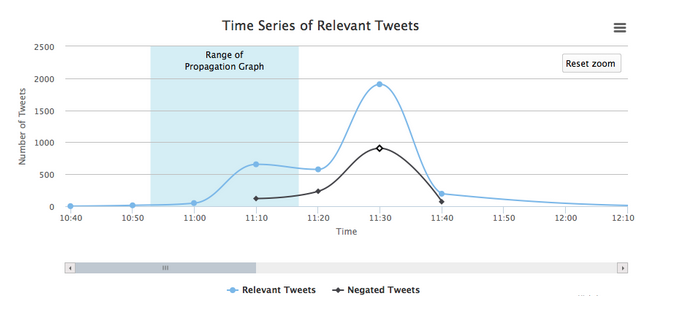
This graph showing the flow of tweets about the suspected Canary Islands plane crash. (Screenshot)
Retweet Network
The network of retweeting users is one of our network visualizations. The points in this graph represent users, and lines connecting them represent that that one user has retweeted another.
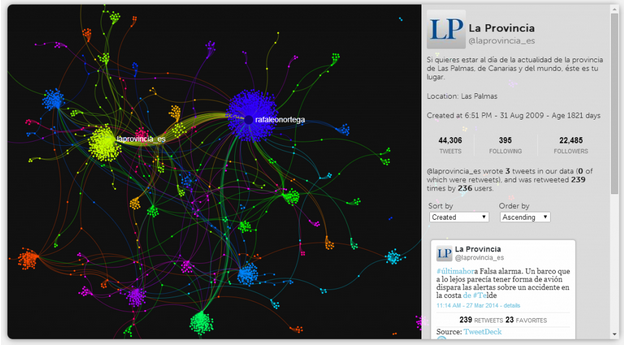
This graphic shows which Twitter users retweeted tweets from other Twitter users about the suspected Canary Islands plane crash (screenshot).
The main actors, users who received the most retweets, appear largest and most prominent in this graph. @rafaleonortega appears as the most retweeted node in the graph (around 600 retweets), since he broke the story. @laprovincia_es is also highly visible, with 236 users retweeting its tweet that declared the story untrue.
For the reporter investigating the story, the decision whether to retweet is now much clearer. The information that a plane had landed in the water was false and retracted easily. The rumor was inspired by an image which appeared to back up the claim. However, the denial of the rumor came only minutes after it was posted, with some official accounts like @112canarias correcting information they had already posted: what looked like a plane was, in fact, a tugboat (more obvious in a close up of the object):
A closeup of the tugboat that some Twitter users mistook for a plane crash near the Canary Islands (screenshot)
This is one of the many stories we have investigated using TRAILS. Along with the Propagation and Retweet Network visualizations, TRAILS provides a variety of other interactive tools to allow users to explore their story:
- a “Timeline Visualization” to graph the activity of various series over time, including the relevant tweets, negation tweets which express doubt, and customizable searches
- the “Co-Retweeted Network” which graphs influential and similar users in the data by linking them with other users who have been retweeted by a third user
- the “Tweeted Link Bibliography” which displays the most tweeted links as well as allowing the user to browse through the tweets containing those links
- a “User Search” to display the tweets written by a single user
- a “Tweet Similarity” visualization to display tweets with similar language to help identify spammers and users posting nearly identical content
- a gallery of the “most retweeted images” to browse through.


Leave a Comment