
Editor’s Note: This Q&A is part of “Newsroom Spotlight,” a series of conversations with journalists about what’s going on in their newsrooms and the media industry. The interview excerpts have been lightly edited and organized for clarity.
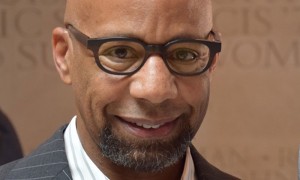
Building an online presence is nothing new for Joshua Topolsky, editor of Bloomberg Digital and Bloomberg Media’s chief digital content officer.
The 37-year-old came to Bloomberg after founding The Verge, a Vox Media venture that covers innovation in art, science, technology, and culture.
His talent for seeing the intersection of different beats stems from the overlap of his own interests: Before specializing in technology news, Topolsky worked as a DJ and music producer.
He carried his love for synthesis to the newsroom, where news, data, and graphics teams all collaborate to create the Bloomberg online experience.
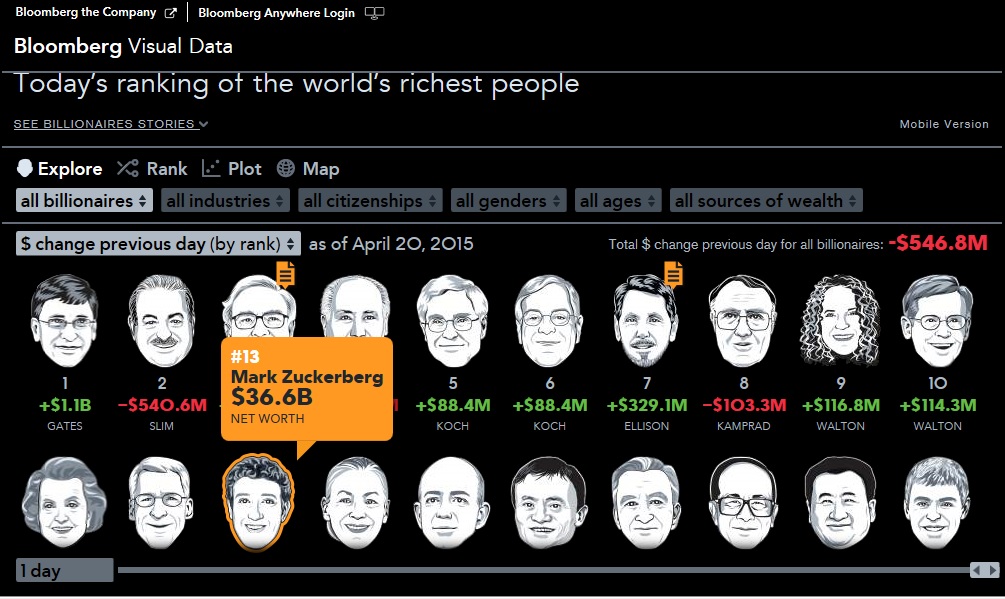
Topolsky was named Adweek’s Digital Editor of the Year in 2012 and focuses on interactive graphics and data visualization. Some examples of interactive data projects at Bloomberg can be found here.
American Journalism Review: How many visual digital pieces, both static and interactive, does your team typically produce each week?
Considering both static and interactive, I think we’re probably doing between 25 and 40 a week. It depends on the week and what’s happening, but we’re producing quite a few.
AJR: How much time do you typically give each project?

Joshua Topolsky, Bloomberg
Topolsky: Every project is different – some are very time sensitive because there’s news happening. Sometimes it coincides with an event so have a drop deadline. But a lot of the time, with particularly the more complex graphics we do, … it will come down to scheduling. If it’s more of a feature story, those can sometimes take weeks or months. Other times it’s a project that’s going on in the background, where we want to do something, and we’re trying to find a way to express the data together, but there’s not fixed deadline. When we feel the project is ready, … that’s when we roll it out. But sometimes we need something in an hour.
AJR: How do you incorporate visuals and interactive elements when dealing with breaking news?
Topolsky: That is an area where we’re still experimenting. The graphics team meets with editorial at our daily meetings, so there’s an information transfer there, and when there’s breaking news, they sit right next to us on the editorial floor. It’s very easy to walk over – or scream sometimes – and ask, “Hey! Are we doing X, Y or Z on this thing?” The key is that no matter what aspect you’re looking at – text, images, video, graphics, interactives – we’re all making the same stuff. We have to be thinking about these teams as part of the same team. We’re all editorial, and we’re creating editorial products. It’s important to keep those lines of communication open for everybody.
AJR: So would you say your newsroom is very synthesized with separate teams and departments often working together?
Topolsky: Absolutely. One of the things that I’ve really tried to do since I’ve been at Bloomberg with the digital team is constantly looking at workflows and tools and figuring out how we can make these things more connected. Ultimately, on the web you really can’t have a satellite story that lives on its own. There’s always another component – maybe a companion piece or a sidebar –… that have to connect.
AJR: How do you manage ongoing projects and pieces that constantly need updating?
Topolsky: The graphics team is, in many ways, self-contained. They have groups working on faster pieces and groups working on the bigger feature graphics, with some overlap. They’re also consistently updating the pieces we’re keeping alive. It’s kind of a core responsibility of the graphics team to build and maintain the stories we know are going to be more evergreen.
AJR: Do you have a favorite story you’ve worked on?
Topolsky: We did a really beautiful piece about America shaking off its addiction to oil in January. This was actually built off a framework the graphics team had used before, and they took it even further. In some ways it even feels like an animated video when you go through it. They really took the template they had used before, expanded on it, refined it, and really built it out. I think they started on a Monday and put it out on a Thursday, so I consider it to be a really hectic interactive with a beautiful and engaging presentation. What I love about it is that we were able to refine something that we had done previously and turn something new around very quickly.
AJR: Do a lot of your projects stem from templates you’ve used in the past?
Topolsky: A lot of them are built from pieces. The oil piece referenced pretty heavily one we had done in the past, but sometimes they’re totally bespoke. It’s a mix and match.
AJR: What makes the interactive data and graphics projects at Bloomberg new and unique compared to other news organizations?
Topolsky: Most importantly, we have an enormous wealth of data because of the terminal at our core business. We’re able to pull some really interesting metrics. Not all our projects are based off data coming from the terminal, but I think we have access to a much wider collection data than most publishers. Even if we’re not using data specifically for a piece, we’re able to use it as context for the piece.
AJR: What do you think is the next big thing?
Topolsky: A big question I have is always, “How do we better integrate, and how do we create pieces that are dynamic?” We want things that aren’t just graphics, but a combination of everything we’re able to do. We want to keep growing and integrating these pieces. Although we do some standalones, I really want everyone to be able to work in unison. So the first big thing is collaboration and increasing that and finding new ways to do things better – the other piece is breaking news. We can get better, faster, and smarter on how we bring data and interactive into a breaking news sphere. That’s something I’d like to devote a lot of time and energy toward.
AJR: Do you make anything that’s specifically targeted for social media?
Topolsky: We do elements of pieces for social media, and we’ll often break out specific visualizations or numbers, but I don’t think we’re ultimately doing anything just for the sake of putting it on social. It needs to be reflective of the piece we’re doing and bring people back to the larger case.
AJR: Do you have any advice for other newsrooms entering the data visualization field?
Topolsky: Don’t hesitate, and make sure you’ve got the right people working together. You can get the best developers in the world and the greatest data analysts in the world, but if they are not paired with editorial and don’t have the sensibilities of editorial, it can be very difficult to create compelling experiences.
AJR: Do you have anything else to share that I didn’t ask about?
Topolsky: I think this is a really new, interesting place where journalism lives, in terms of expressing stories through data and in interactive ways, and we’re just at the start of it. It’s so early, and we’re learning so much from the experiments that we’re doing. It’s very much a work in progress, and I think every day we’re finding new, inventive things we can do with the products. Every day is experimentation, with tweaking things and trying things to see how they’ll take.