
Editor’s Note: This article is part of Storybase, a series of occasional articles exploring new forms of interactive storytelling.
Newtown. Aurora. Columbine. Those tragedies are indelibly imprinted on the national consciousness because of the number of deaths to innocents.
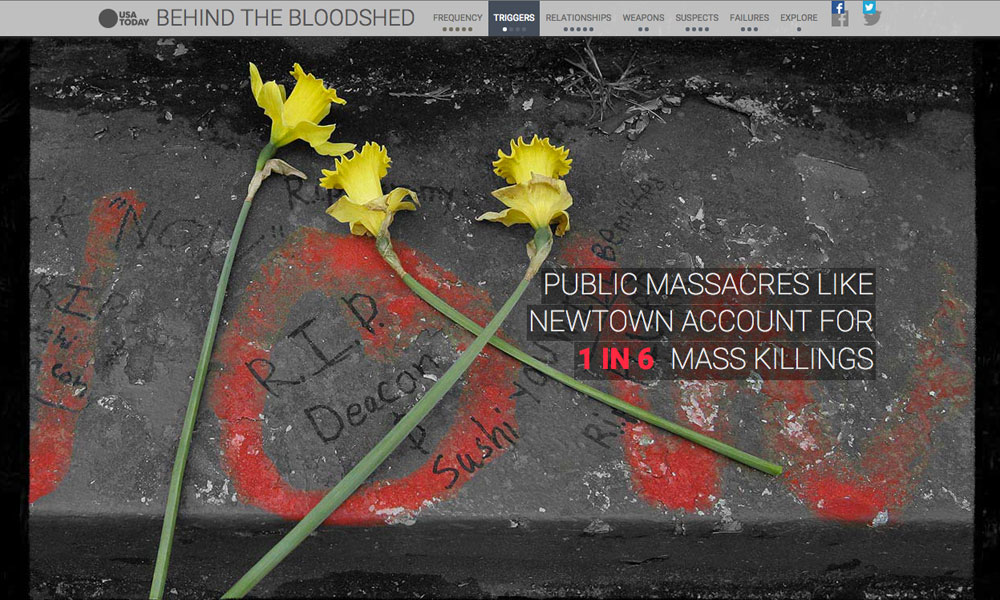
But what of tragedies of smaller scale? In 2012, USA Today began a multi-month-long investigation into data to discern other deadly patterns, culminating in the publication of “Behind the Bloodshed” in 2013.
It is believed to be the deepest journalistic resource to date on mass killings in the U.S. that claimed at least four victims, and the project provides so much context to mass killings that the team updates it regularly.
Project manager Jodi Upton, also a senior database editor at USA Today, led a team of data experts, designers, editors, web developers and others to create a multilayered interactive that has garnered numerous awards, including the National Headliner Award and the World Media Summit innovation award.
The design allows a user to examine frequency of the incidents, triggers for mass killings, relationships with the killer, weapons used, suspects and failure pressure points that led to the tragedies. It’s a savvy presentation of more than 250 events that includes charts, graphs, news clippings and statistics, either guided by chronology, incident, region or number of casualties.
So captivating was the packaging that Upton said the project received more than a million page views in the first few weeks.
American Journalism Review interviewed Upton to learn more about the project. Below is a transcript of that interview, lightly edited and organized for clarity.
American Journalism Review: First, how did your team come up with the idea for this story?

Senior database editor Jodi Upton leads USA Today’s data-rich reporting on projects ranging from gun violence to product recalls to sports contracts.
Jodi Upton: It started before Newtown, and we had a relatively new editor [Dave Callaway, who arrived at USA Today in July of 2012] and he wanted us to do something about mass killings – meaning some kind of coverage about it. On the data team, we decided that if we were going to do this, then we were going to do it better than anyone else was able to do it. And look at the impetus and find out how many there actually were, check the FBI records, all of those things, and see what we really do know about mass killings in the U.S.
AJR: What was your primary method for gathering all of the information needed?
Upton: We started with the FBI supplementary homicide data, and as we looked at it we knew pretty quickly it was missing a lot of incidents. And the incidents that were in there were not actually mass killings. By the time we were done, [we found] the FBI data is only correct about 50 percent of the time. And that’s because they include incidents that may have occurred 30 years [ago,] and it’s a cold case and they finally make an arrest. It could be just bad data entry from someone at the local level. There are a hundred reasons it may not be correct, but in the end, nobody had really good information on how many mass killing there were in the U.S. and where they were and how they happened.
AJR: How much work went into this project?
Upton: I would put it in two phases. As I mentioned, the idea for this coverage started before Newtown. We were looking for different ways that we could do it. Different methodologies we could use. We already had this homicide data when Newtown happened. And that of course changed the national conversation. So we started doing a lot of stories about the data right then, even though the interactive was still months away. For the interactive, which I would call the second phase, we would have been reporting on this data for four months before we started getting underway …. That’s when we started looking at what story we wanted to tell here that is different from the other story that we have already been telling. And that’s where we came up with the idea.
AJR: Why did you decide to use this format rather than construct an in-depth series on the topic?
Upton: There are a couple of reasons. One was everybody knows something about mass killings. Everybody remembers Newtown. Everybody remembers Aurora. But we wanted to look beyond instances that are really well known. And we wanted to look at all kinds of instances because most of the organizations that have been doing this kind of data [analysis] either cherry-pick their data, somewhat, or don’t include gang-related or something that looks like gang-related or drug-related. They don’t include any of those instances even though they may include innocent bystanders. We wanted to get at more than the Newtown or the Auroras of the world. And it involves a lot more families. It involves a lot more kids. It involves a lot more than we initially think about.
AJR: How did you decide on the different tabs focused on frequency, relationships, weapons, etc.?
Upton: We wanted people to be able to explore the data for themselves. So instead of saying, “This is what we need to know about mass killings,” people could look at every single incident if they want to, which is what the map is for. They can look at the gun and the gun caliber. One of the findings that we used here is that about 25 percent of the time a gun is not even used in a mass killing. So we wanted them to explore that. What are the relationships in these with the killers? All these things sort of illuminate what is going on with mass killings. So it’s not just the unknown killer, perhaps in odd clothing, walking into a public place.
AJR: What were the different responsibilities distributed for this project and who was responsible for them?
Upton: [Investigative reporters] Meghan Hoyer and Paul Overberg took the lead on data, looking at all the incidents, verifying them, building on a database that is highly relational and doing a lot [more] … than just a list of incidents. Meghan did a lot of the reporting and writing. Paul did a lot of reporting. They all contributed to thinking about the interactive and the story we wanted to tell. And Gannett Digital, a partner company that is actually downstairs from us, did the actual development in terms of the design. And honestly, there were a lot of things we rejected. There were designs that we didn’t think were necessarily appropriate for the subject. We wanted to be respectful and at the same time allow people to look at the story.
AJR: Is the project static or do you continue to update the statistics?
Upton: We keep updating it. We keep looking at the FBI Supplementary Homicide Report when it comes out, but it’s always about a year and a half delayed. For example, [the February 27 shooting] in Tyrone, Missouri, looks like it fits the description of a mass killing, so we [immediately start to update] with the information we have. We will keep updating it as we get more information on the victims’ [ages and relationships]. As we keep updating it we get requests from academics who want to use our data, as it is the most complete set on the subject.
AJR: What was the audience reaction to this piece?
Upton: We had in the first week or so more than a million page views on the interactive, which is really, really good. People were not only going to it, but they were highly engaged. They were spending quite a bit of time looking through it. And to us that is somewhat gratifying for such a grim subject. It means people do want to explore data. They don’t always want to be told what the story is. They want a chance to explore the information at their own speed and in their own way.
AJR: Was there ever a fear that the subject matter was too grim and that readers wouldn’t want to delve into mass killings?
Upton: I wasn’t worried so much, but I think it is a good point to raise. When there is a large mass killing like in the Navy Yard, and others that I mentioned, it is everywhere in the news. What we were trying to do is provide context to those incidents. When you see non-stop coverage on TV of some of these killings, it gives you perspective. It is still grim, but at least you get a sense that these are not quite as random and people might think that they are.
AJR: Would you do more in-depth data-driven work like this centered on an interactive?
Upton: We definitely do that kind of thing. We just did another thing, Changing Face of America, which Paul also worked on, which looked really in-depth at the changing of demographics by looking back 50 years and looking forward 50 years of the racial makeup of Americans. We do a lot of those kinds of deep dives. Would we want to do something on a police issue again? I don’t know. We were all involved in that project for a long, long time, and it was a little bit grim. Whatever is a really good story we will pursue.